Troubleshooting: Overview
Overview of ways to get help with troubleshooting Policy Manager and Network Director.
Table of Contents
- Overview
- Documentation Summary
- Contacting Technical Support
- Monitoring Tabs: Alerts and Logs
- Log Files
- stdout.txt File
- Monitoring Tool
- Restarting the Container: General Information
- Knowledge Base
- Release Notes
- Product Documentation
Overview
Over the course of using Policy Manager and Network Director, or other Akana products, you're likely to have to do some troubleshooting from time to time. Due to the relationship between the various containers and a selection of different type of web services, security, databases, and networks, there is a wide range of issues that might occur.
These products are deployed in a wide range of environments, and interface with a wide selection of products and versions, including operating systems, databases, servers, firewalls, security mechanisms, and others. It is important to take an orderly approach to installation, deployment, and troubleshooting.
If you encounter errors, check this publication and the resources referenced here.
This document also includes information about contacting technical support. Finally, it includes some resource material such as firewall settings and database queries for your reference.
Documentation Summary
The table below provides a summary of the information in this troubleshooting documentation and how it is organized.
| This section... | Provides this information... |
|---|---|
| Introduction | General information about information resources available, information about working with Support, general information about basic troubleshooting tools. |
| Troubleshooting Policy Manager | Troubleshooting information for Policy Manager |
| Troubleshooting Network Director | Troubleshooting information for Network Director |
| Reference: Database Queries | Examples of database queries you can use to resolve issues or optimize. |
Contacting Technical Support
If you experience an issue with an Akana product, you can contact Akana Technical Support.
For information about how to contact Technical Support, and what information to provide, see Customer Support.
Monitoring Tabs: Alerts and Logs
Monitoring information, including alerts and logs, is available at the following levels:
- For the entire organization
- For each container
- For each service
- For each contract
At each level, a monitoring tab gives you access to alerts, logs, and other information so that you can view the state of functions in real time.
For information about the Monitoring > Alerts and Monitoring > Logs tabs, see Monitoring Tabs: Alerts and Logs.
Log Files
By default, Policy Manager and Network Director only log errors (exceptions) that happen over the course of normal usage. If you are having any runtime processing errors or issues while performing some action in the Policy Manager console, applicable errors will generally be logged in the log file for the applicable container.
This section includes the following information about log files:
Note: There is another type of log that you can enable if needed. In the Policy Manager Administration Console, Configuration tab, choose the configuration category of com.soa.transport.jetty and enable the NCSA Access log (set the ncsa.access.log.enable property to true). Then, in the ncsa.access.log.filename field, specify the location for the log file. After that, access to any page in the Policy Manager Console or the Akana Administration Console for the Policy Manager instance generates an entry to the specified log file.
File Location
Each instance has its own set of logs at the following default location:
{installation directory}/sm60/instances/{instance name}/log
The default behavior for the logging system is to have a maximum of ten backup logs at 4.7 MB (5000000 bytes) each. When a log reaches 4.7 MB in size, the logging information rolls over into the next file. Once the total number of log files reaches 10, the oldest file is deleted when the new one starts.
Modifying the Default Logging Behavior
You can modify the default settings for logging behavior, along with the level of logging and other customization, in the Akana Administration Console for the Policy Manager and Network Director instance.
To modify the default logging behavior
- Log in to the Akana Administration Console for the Policy Manager or Network Director instance.
- Click the Configuration tab.
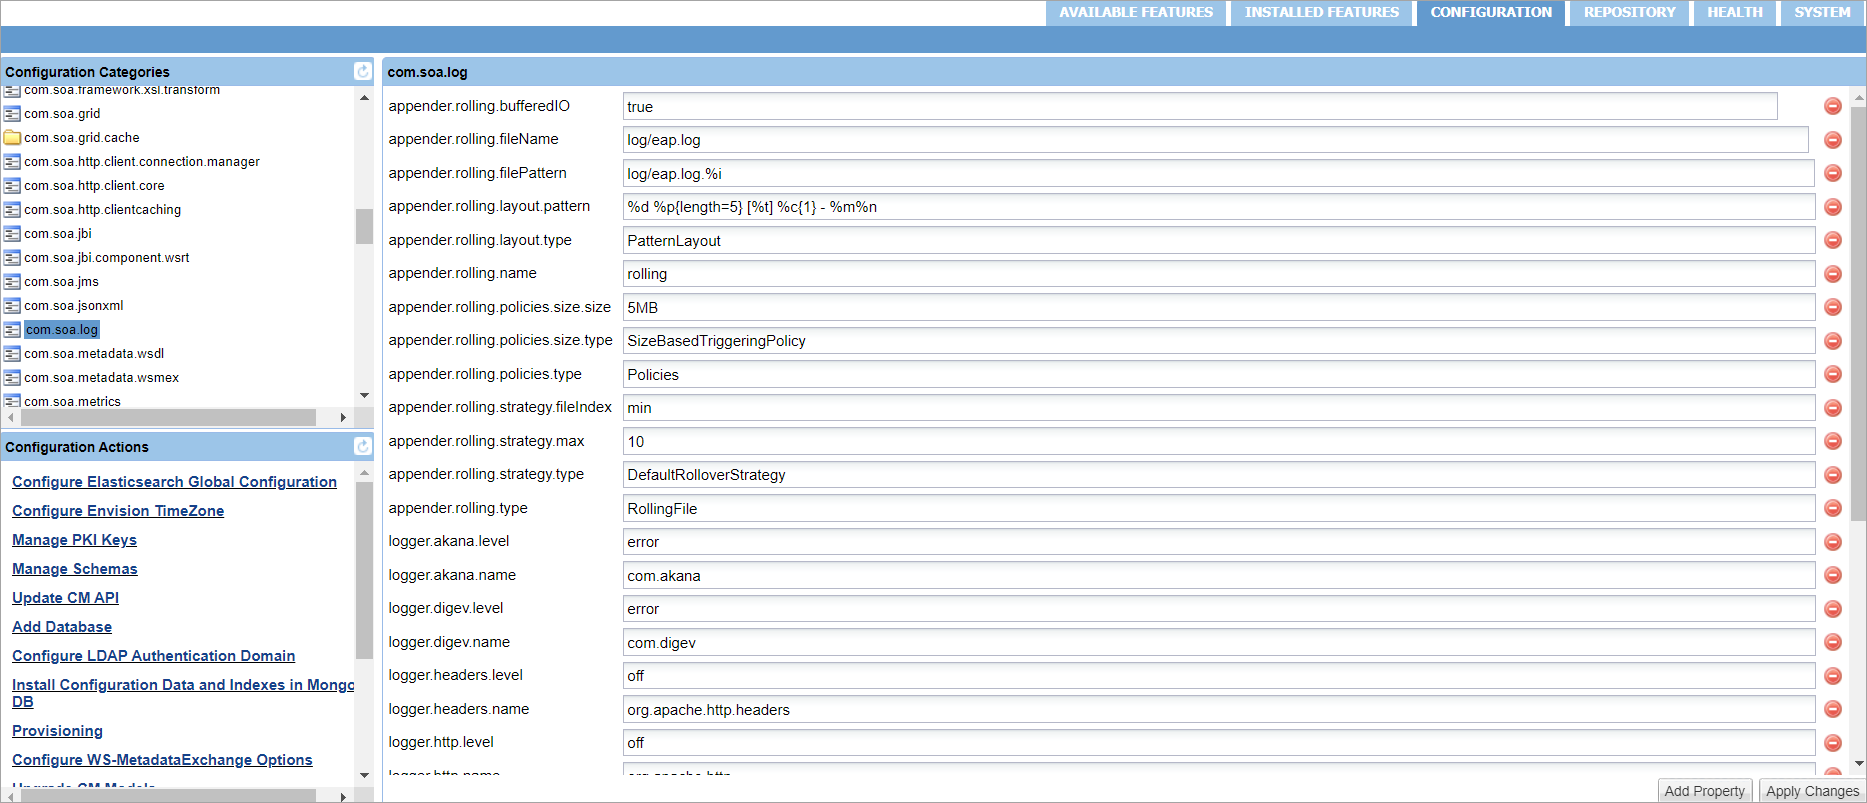
- From the configuration categories on the left, find com.soa.log.
- In the properties panel on the right, you can customize and control the logging for each log file by modifying the property as needed. For example, to modify the default logging behavior for logger.soa.name, change the log level for the following property to:
- logger.soa.name: com.soa
- logger.soa.level: error
- Click Apply Changes.
Turning Trace Logging On
If a problem with a container persists, you could enable trace logging in the Akana Administration Console. Trace logging is enabled dynamically and does not require a container restart.
Depending on the category for which trace logging is enabled, detailed information is collected in the log file, including such activity as:
- Internal communication between Akana containers
- Database queries
- Incoming requests
- Certificate information
- Scheduled jobs
When the troubleshooting is complete, trace logging for the specific category should set back to the default setting of error.
A good practice is to figure what action is causing specific symptoms in the container, and turn on trace logging only while that action is occurring. For example, if a service detail page is coming up blank, you might want to see what Policy Manager is doing when you click on the service detail page. You would set the logging level to trace, click on the service detail page, and then change the level back to error and analyze the logs.
To turn trace logging on or off
- Log in to the Akana Administration Console for the Policy Manager or Network Director instance.
- Click the Configuration tab.
- From the configuration categories on the left, find com.soa.log.
- In the properties panel on the right, enable or disable trace for all runtime activity on the container. For example, to turn on or off the trace logging for logger.akana.name, modify the following property to:
- logger.akana.name: com.akana
- To enable: logger.akana.level: Switch from ERROR to TRACE
- To disable: logger.akana.level: Switch from TRACE to ERROR
- Click Apply Changes.
stdout.txt File
If there is an issue with the bundles not starting, you can check the stdout.txt file to get additional information for troubleshooting purposes.
This file is created whenever the container starts up. It is stored in the instances folder (instances/{container name}/log/stdout.txt).
Normally the file contains a one-line message stating that the bundles have started. However, if the bundles fail to load, the errors that occur during the container initialization process are recorded in this file. Errors relating to bundles loading do not appear in the Policy Manager log files, since logging of messages starts when the container has started.
Monitoring Tool
All Policy Manager containers include an optional Monitoring Tool to help troubleshoot issues related to the container resources. It is not installed by default but you can easily install it. You can use this tool to monitor and analyze the following:
- Incoming HTTP connections (com.soa.transport.httpclient)
- Database thread pool (com.soa.database.config.{db-config-id}-mon)
- Active/idle Policy Manager processes (com.soa.framework)
- Container memory usage (com.soa.vmstats)
- Outgoing HTTP connections (com.soa.transport.jetty)
- Monitoring queues (com.soa.usage)
- JMS connections (com.soa.transport.jms)
To install the monitoring tool
- Log in to the Akana Administration Console for the Policy Manager or Network Director instance.
- Click the Available Features tab.
- From the Filter drop-down list at the top of the left panel, choose Tool.
- Click the checkbox for the Akana Admin Monitoring Tool and click Install Feature.
- Restart the container.
- After restart, verify that the Monitoring tab is now present in the Akana Administration Console, as shown below.
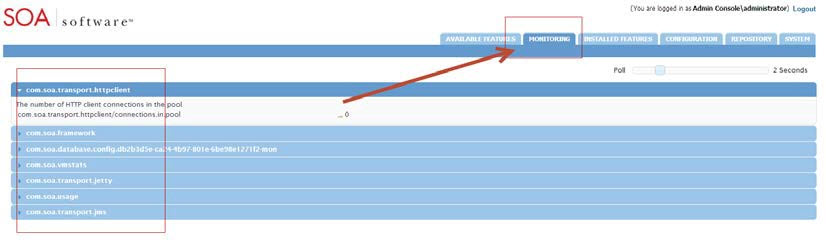
Note: This tool does not require additional machine or container resources to run. Before closing the tool, set the polling interval to 0.
Restarting the Container: General Information
Some types of changes that you might make will require restarting of the container before the changes go into effect. Other types of changes are effective immediately, without restarting the container.
In most cases, specific procedures and issue resolution notes in this document state whether you need to restart the container or not. In general, configuration changes do not require restart unless they include changes to the container listener or database. If you add or remove container features you'll need to restart the container for the changes to go into effect.
Examples of changes that require restart:
- Adding the monitoring tool in the Akana Administration Console for the Policy Manager instance
- Changing database properties such as username, password, or hostname
- Changing the port number for the container listener (for Policy Manager versions 6.0 and prior)
Examples of changes that do not require restart:
- Increasing the log level to TRACE
- Adding an HTTP route configuration file to the /instances/ {ND}/deploy folder
- Adding an identity system such as LDAP to the Policy Manager Workbench
- Changing the port number for the container listener (for Policy Manager version 6.1)
Determining Where to Look for Error Information
When trying to narrow down information for troubleshooting purposes, it might be useful to know what symptoms are likely to relate to which container types.
| You might find info about these types of errors... | In this location... |
|---|---|
| Issues with Policy Manager (for example, usage writer or container configuration), user interface issues, search results, and some database issues. |
Policy Manager log files. These types of issues are generally a problem with the Policy Manager instance. |
| 404 when invoking a service, bad context paths, virtual service authentication errors, authorization errors, or routing issues. |
Network Director log files. Possibly also Policy Manager log files. These issues are likely to relate to the Network Director. However, since the Network Director communicates with the Policy Manage to retrieve information, in many cases the Policy Manager logs are helpful as well. |
| Container initialization. |
stdout console or the stdout file. Any errors that occur during the container initialization process are written to stdout. |
Knowledge Base
The Rogue Wave Akana knowledge base, https://library.roguewave.com/display/SUPPORT/Akana+-+Knowledgebase, includes many type of information such as:
- How-to articles
- Product compatibility matrices
- Troubleshooting articles
Release Notes
It's possible that you could encounter a bug that might have been resolved in a later version of the product. For this and other reasons, it's a good idea to check the release notes for versions later than yours.
The release notes for each product version include information about the bugs/issues that have been fixed in that version, as well as information about new product features and enhancements. You might find that the problem you encountered was resolved in a later version.
To view release notes
- Log in to the Rogue Wave Support Center (https://library.roguewave.com).
Note: If you don't have a login for the site, contact Akana technical support to get access.
- In the My Resources section, click Product Downloads, then click Akana - Product Downloads (https://library.roguewave.com/display/SUPPORT/Akana+-+Product+Downloads).
- Find the release notes and download the file.
Product Documentation
When you download your installation executable files, make sure you get and read the product documentation. The documentation for each product includes general information about installation and often includes troubleshooting information for the specific product.
Updates to documents are available from time to time on the Support site.


