Troubleshooting Policy Manager
Information to help you troubleshoot issues that might come up with Policy Manager.
Table of Contents
- Troubleshooting Issues: System Administrator
- Troubleshooting Issues: Policy Manager Administrator
- Miscellaneous Items:
Troubleshooting Issues: System Administrator
The earlier sections of this document provide information about issues a System Administrator might encounter with Policy Manager. It includes:
- Database Issues
- Monitoring Issues
- Console Login Issues
- Issues with Alerts
- Unable to Start a Container
Database Issues
This section provides information about issues that might occur relating to your database, with suggestions and instructions to help you resolve the problem. It includes:
- Database Connections All In Use (Connection Pool Exhausted)
- Database Locks on soa_qrtz_locks Table
- Policy Manager Alert Code 92304, Retry Count Exceeded, when Database is Not Full
- Database Password Expired
- Database Thread Lock
Database Connections All In Use (Connection Pool Exhausted)
If database connections are all in use, virtual services on the Network Director might not be accessible. You might also see an out of memory error in the stdout log or console, and see the error message below in the log file:
SQLNestedException: Cannot get a connection, pool exhausted.
This can happen, in an environment with high traffic, if all database connections might be used by Policy Manager.
You can verify this with the monitoring tool for the Policy Manager container. If you see the error message listed above, the database connections are all in use.
Solution:
One resolution is to increase the maximum number of database threads. To do this, follow the steps below.
To increase the maximum number of database threads
- Log in to the Akana Administration Console for the Policy Manager instance.
- Click the Configuration tab.
- In the Configuration Categories section on the left, choose com.soa.database.config, and then select the applicable config ID.
- Change the maxPoolSize value from 20 to 50 and must not exceed 500.
- Click Apply Changes.
Note: The settings take effect immediately. You do not need to restart the container.
Database Locks on soa_qrtz_locks Table
If the DBA reports that there are database locks on the soa_qrtz_locks table with the Policy Manager database, it is probably because the Quartz scheduler is running on more than one Policy Manager instance.
The Quartz scheduler can only run on one Policy Manager instance. If your environment includes multiple Policy Manager instances, and more than one of them has the org.quartz.scheduler.enabled value set to true, it's likely that there will be issues with database locks on the soa_qrtz_locks table.
You'll need to determine which Policy Manager instance you want the Quartz scheduler to run on, and then disable it on any other Policy Manager instances.
Solution:
Verify that the Quartz scheduler is running on only one Policy Manager instance.
To set the Quartz scheduler to run on only one Policy Manager instance
- Log in to the Akana Administration Console for the instance of Policy Manager that you want the Quartz scheduler to run on.
- Click the Configuration tab.
- In the Configuration Categories section on the left, choose com.soa.scheduler.quartz, and then click the container.
- On the right, make sure the org.quartz.scheduler.enabled value is set to true. If you change the value, click Apply Changes.
- Log in to the Akana Administration Console for the next instance of Policy Manager. Make sure the org.quartz.scheduler.enabled value is set to false. If you change the value, click Apply Changes.
- Repeat Step 5 for all other Policy Manager instances.
Note: You do not need to restart the container after making these changes.
Policy Manager Alert Code 92304, Retry Count Exceeded, when Database is Not Full
Policy Manager alert code 92304 message text: UsageWriter retry count has been exceeded.
One possible cause for getting this alert code when the database is not full is that there is more than auditing policy applied to the service.
For example, you might have a detailed auditing policy attached and also have the recording component turned on for a pipeline policy.
If you have multiple auditing policies turned on you will typically see this alert. The database constraint does not allow duplicate monitoring of data.
Solution:
Verify that the service being called has only one auditing policy attached to it. If there is more than one, choose the auditing policy you most want to use and remove any others so there is just one auditing policy applied.
Database Password Expired
During the initial install, the database password is set up as part of configuring Policy Manager.
If the database password expires or is changed, Policy Manager cannot access the database.
Solution:
If the database password expires or is changed, you'll need to update it in Policy Manager.
Note: If the database password expires, contact the database administrator and if possible set the password to never expire. If this is not possible due to company security policies, follow the steps below to change the password.
To change the database password in Policy Manager
- Log in to the Akana Administration Console for the Policy Manager instance.
- Click the Configuration tab.
- In the Configuration Categories section on the left, choose com.soa.database.config, and then select the applicable config ID.
- In the password field, specify the new password.
- At the bottom right, click Add Property. The Add Configuration Property overlay appears.
- Enter the following:
- Property Name: encryptValues
- Property Value: false
- Click Apply to save the change and close the overlay.
- Click Apply Changes.
- Restart the Policy Manager instance.
Container Running Out of Memory
If the container is running out of memory, it could be because the automated rollup data deletion job is running, consuming memory.
By default, Policy Manager creates rollups for its own services, recording performance statistics for calls made to it, usually from Network Director.
The rollup data accumulates in the database over time if not cleaned out regularly. Automatic rollup data deletion jobs periodically clean out the accumulated data, but can slow down the system and even cause out of memory issues.
The automatic rollup data deletion job retrieves information older than a specified date, archives the data in the Export folder, and then deletes the archived information from the database. The job runs in the Policy Manager container. If there are a lot of calls to Policy Manager at the time the job is running, you might see a condition where the Policy Manager container runs out of memory.
Solution:
If there are memory issues and you suspect the automated data deletion jobs are the cause, you can change the settings so that the data deletion job does not run automatically.
If your system is becoming slow, or you are getting memory errors, it might be because of the job that is required to process all the rollup data.
Typically, if there is a memory error, the container will consume all the CPU cycles and the memory usage for this process will be at 100%.
Some troubleshooting steps you can take:
- Add the monitoring tool. This will help you determine the issue. See To install the monitoring tool.
- If the metrics are not important, you can disable the setting in the Akana Administration Console for the Policy Manager container so that they are not generated (see To disable unnecessary rollup data metrics below).
- You can manually delete unnecessary data from the database (see To manually delete unnecessary rollup data from the database below). Some customers prefer not to have automatic rollup data deletion jobs scheduled so that they can choose the best time to run this maintenance task.
Note: If you do this, you'll need to delete the data manually later.
- If you continue to experience memory issues after disabling the automated data deletion job, you can allocate more memory to the container Java process. The default is 1 GB, but you could increase the memory to 2 GB or more by changing to 64-bit JRE (see Out of memory errors on the error log).
To disable unnecessary rollup data metrics
- Log in to the Akana Administration Console for the Policy Manager instance.
- Click the Configuration tab.
- In the Configuration Categories section on the left, choose com.soa.metrics.
- In the right pane, set the value of the metrics.rollup.reporter.requireMetricsPolicy property to true.
- Click Apply Changes.
To turn off automatic monitoring data deletion jobs
- Log in to the Akana Administration Console for the Policy Manager instance.
- Click the Configuration tab.
- In the Configuration Categories section on the left, choose com.soa.rollup.delete.old.
- Change one or more of the rollup enable properties from true to false.
- Click Apply Changes.
Note: You must restart the Policy Manager container for the change to take effect.
To manually delete unnecessary rollup data from the database
To manually purge the rollup data from the database, run the queries below.
Note: Modify the date in the scripts below to reflect how much data you want to delete (the to_date value). Any information older than the date you specify is deleted.
Backing up before deletion—You can also back up the data before deletion, or you can export the monitoring data before deletion.
Delete rollup (chart) data script:
delete from MO_ROLLUPDATA where INTVLSTARTDTS < to_date ('2013-12-01 00:00:00', 'YYYY-MM-DD HH24:MI:SS')
delete from MO_ROLLUP15 where INTVLSTARTDTS < to_date ('2013-12-01 00:00:00', 'YYYY-MM-DD HH24:MI:SS')
delete from MO_ROLL_ORG15 where INTVLSTARTDTS < to_date ('2013-12-01 00:00:00', 'YYYY-MM-DD HH24:MI:SS')
delete from MO_ROLLUP_HOUR where INTVLSTARTDTS < to_date ('2013-12-01 00:00:00', 'YYYY-MM-DD HH24:MI:SS')
delete from MO_ROLL_ORG_H where INTVLSTARTDTS < to_date ('2013-12-01 00:00:00', 'YYYY-MM-DD HH24:MI:SS')
delete from MO_ROLLUP_DAY where INTVLSTARTDTS < to_date ('2013-12-01 00:00:00', 'YYYY-MM-DD HH24:MI:SS')
delete from MO_ROLL_ORG_D where INTVLSTARTDTS < to_date ('2013-12-01 00:00:00', 'YYYY-MM-DD HH24:MI:SS')
Monitoring Issues
This section provides information about issues that could affect your monitoring data, with suggestions and instructions to help you resolve the problem. It includes:
- No Data In Historical Charts
- Historical Charts Displayed for Some Increments but Not Others
- Historical Data Shows but Real-Time Data Does Not Show
No Data in Historical Charts
If you are seeing real-time charts, but there is no data in the historical charts, it might be because the MAX_ID value in the MO_STATUS table has reached its limit.
Solution:
To resolve this issue, run the following query on your Policy Manager database:
select MAX(ROLLUPDATAID) from MO_ROLLUPDATA
update MO_STATUS set max_id = <result from the above query>
update SOA_QRTZ_TRIGGERS set TRIGGER_STATE = 'WAITING' where
job_name='ms.generate.rollups.job.Trigger'
Historical Charts Displayed for Some Increments but Not Others
Note: This issue might occur in the Policy Manager 6.x environment for systems upgraded from an earlier version of Policy Manager. For new 6.x installations it will not occur.
Issues with historical chart information display are frequently due to the time zone configuration settings in Policy Manager. For example, if you can see daily data by the hour and weekly data by the day, but cannot see monthly data by day or week, this is caused by a configuration issue.
Historical chart data is stored in the ROLLUP data tables in the database. By default, this data is stored in GMT time. However, when you go to the Policy Manager Workbench, on the monitoring tab of the service, you will see that the time is shown in the time zone you configured in your Policy Manager profile.
To see accurate historical information for your implementation, this data should be set to display in the same time zone as your Policy Manager profile.
Note: Some locations have a time zone offset that isn't in whole hours; for example, Bangalore, India. In this scenario, there is another configuration setting that would also need to be changed, to set the configuration rollup offset to 30 minutes. See To configure the time offset for the rollup data tables below.
Solution:
To configure the time zone setting for the rollup data tables, follow the steps below.
To configure the time zone setting for the rollup data tables
- Log in to the Akana Administration Console for the Policy Manager instance.
- Click the Configuration tab.
- In the Configuration Categories section on the left, choose com.soa.rollup.configuration.
- In the right pane, set the monitoring.rollup.configuration.dailyRollupTimeZones property.
This property should list the time zones for which you want to collect the historical data. For example, to collect usage data for the GMT and MST time zones, you would enter: GMT, MST.
- In the right pane, set the statistic.dao.timeZoneMappings property.
This property value should list the time zones that you want the data to display in when it is viewed in the console. For example, to display the historical charts for both GMT and MST, you would enter: UTC:GMT, America/Phoenix:MST.
Note: If you are not sure what value to use for time zone, you can check the setting in Policy Manager. In the Policy Manager Console, at the top right, click MyProfile and check the value specified in the Time Zone field. The user profile and the rollup tables should both be set to the same time zone.
- Click Apply Changes.
To configure the time offset for the rollup data tables
Some locations have a time zone offset that isn't in whole hours; for example, Bangalore, India. In this scenario, there is another configuration setting that would also need to be changed, to set the configuration rollup offset to 30 minutes. Follow the steps below.
The default value is 0, which means that rollups are per hour, on the hour. When this value is set to 0,30, rollups are also created for each hour, on the half-hour.
- Log in to the Akana Administration Console for the Policy Manager instance.
- Click the Configuration tab.
- In the Configuration Categories section on the left, choose com.soa.rollup.configuration.
- In the right pane, set the monitoring.rollup.configuration.hourRollupMinutesOffsets property.
The default value is 0. To add an hourly rollup that rolls up on the half-hour, set the value to 0,30.
Note: Adding a value, rather than changing the default, will result in two sets of rollup data. If you only have one group of users, in the offset time zone, you can replace the default. If you have users in different time zones, add the value.
- Click Apply Changes.
Historical Data Shows but Real-Time Data Does Not Show
Note: This issue might occur in the Policy Manager 6.x environment for systems upgraded from an earlier version of Policy Manager. In new 6.x installations it will not occur.
If data shows in historical charts but not in real-time charts, this might be because of inconsistent time zone settings on different machines.
For example, if the Network Director time is set to one hour earlier than the Policy Manager machine, you will never see any data in the real-time charts, since there is only a one-hour window in which to view the data.
Solution:
Verify that the time zones are the same on Policy Manager and Network Director.
Console Login Issues
- Cannot Log In to Policy Manager Console When Using Load Balancer
- Lost the Only Admin Password
- Access to the Akana Administration Console Needs to Be Restricted to Localhost Only
Cannot Log In to Policy Manager Console When Using Load Balancer
The user is redirected to the login page when trying to log in to the Policy Manager Console if the Policy Manager Workbench can't access the session, so the user is treated as a new user. If this occurs, there are two things to check:
- Application Layer Persistence setting on load balancer (JSESSION Cookie). If the persistence setting is not enabled, the JSESSION cookie is not passed on to the user, and the user is redirected back to the login page.
- Redirect Rewrite Setting on load balancer (SSL Offloading)
Application Layer Persistence setting (JSESSION Cookie)
Each login session is tracked by a JSESSION cookie. The load balancer must be able to access the session cookie and pass it back to the user.
Make sure the Application Layer Persistence setting is enabled on the load balancer. If the persistence on the load balancer is not turned on, the JSESSION cookie is not passed on to the user. Because the session information is not passed on, the user is redirected back to the login page.
The Application Layer Persistence setting is generally enabled by default. However, if you are experiencing difficulty logging in, it's best to make sure the setting hasn't been disabled.
The proper response to the login page request from the host is shown below. Note the JSESSION cookie on the last line.
GET /ms/index.do HTTP/1.1
Host: pm_host:9900
Connection: keep-alive
Accept: text/html,application/xhtml+xml,application/xml;q=0.9,*/*;q=0.8
User-Agent: Mozilla/5.0 (Windows NT 6.1; WOW64) AppleWebKit/537.17 (KHTML, like Gecko) Chrome/24.0.1312.56
Safari/537.17
Referer: http://pm_host:9900/ Accept-Encoding: gzip,deflate,sdch Accept-Language: en-US,en;q=0.8
Accept-Charset: ISO-8859-1,utf-8;q=0.7,*;q=0.3
Cookie: JSESSIONID_pm_container=6jl7s7i4lm8qg
Solution:
Check/modify the Application Layer Persistence setting in the load balancer configuration page.
Redirect Rewrite Setting on Load Balancer (SSL Offloading)
If your implementation includes SSL Offloading (HTTPS to HTTP) for the load balancer, some Policy Manager console requests are redirected.
SSL Offloading is sometimes used in environments with multiple instances of Policy Manager and a single load balancer receiving traffic on HTTPS when Policy Manager has an HTTP endpoint.
Solution:
In this scenario, you must enable the Redirect Rewrite setting, to follow the redirects. You can modify this setting in the load balancer configuration page.
Lost the Only Admin Password
There is only one administrator password for Policy Manager and it isn't available.
Solution:
You can reset the Policy Manager Console Admin password via the Akana Administration Console for the Policy Manager instance. Follow the steps below.
To reset the Admin password
- Log in to the Akana Administration Console for the Policy Manager instance.
- Click the Configuration tab.
- In the Configuration Categories section on the left, choose com.soa.admin.console.task.status.
- In the right panel, set the value of the com.soa.create.admin.user property to false.
- Click Apply Changes.
- Log out, and then log back in again.
- Click the Installed Features tab. Create Policy Manager Admin User is listed at the bottom as a pending task.
- Click Complete Configuration and set up the admin user.
Note: You will need to restart Policy Manager for the new settings to take effect.
- Run the following database query, which resets the password for the administrator account (and nothing else):
- Log in using the following credentials:
- Username: administrator
- password: password
- Once you're logged in, change the password to a unique and secure password.
Access to the Akana Administration Console Needs to Be Restricted to Localhost Only
For security reasons, it's best to make sure that access to the Akana Administration Console is restricted so that it's only accessible from the local machine (localhost).
To make sure the Akana Administration Console is accessible only from localhost, follow the procedure below.
To restrict access to the Akana Administration Console so that it is accessible only from localhost
- Create a file in the ./sm60 directory named: com.soa.admin.console.cfg. Enter the following lines in the file:
admin.console.localhost.only=true
admin.console.access.restricted=true
- Copy the com.soa.admin.console.cfg file into the ./sm60/instances/ {instance_name}/deploy directory.
- From the Akana Administration Console, go to the Configuration tab. Verify that there is a configuration category named com.soa.admin.console and that it includes these two properties:
- admin.console.localhost.only property set to true
- admin.console.access.restricted property set to true
- Restart the container.
Once this setting is in place, when the container is up and running, the Akana Administration Console should only be accessible on the local machine. If an attempt is made to access it from another machine, a 404 error is returned.
Issues with Alerts
This section provides information about possible issues related to alerts and alert emails, including email configuration and notifications. It includes:
- Alert Notifications Not Configured
- Incorrect From Address On Alert Notifications
- CA Revocation Emails Not Being Sent
- Too Many Alerts/Backlogged Alerts
- Alert SMTP Server Not Set Up
Alert Notifications Not Configured
If you want emails to be sent out for alerts generated, you must configure email alert forwarding and set up email alert properties.
If the necessary configuration is not done, no alert messages are sent out.
Solution:
Configure the email alert forwarding settings.
To configure email alerts
Note: Before configuring email alerts you must set up the SMTP server if it isn't set up yet.
- Log in to Policy Manager.
- Click the Alerts tab.
- Click Email Groups.
- Add or modify email groups as needed.
As part of adding or modifying an email group, you must specify the SMTP server used to send the emails. You can verify that the setup is correct by clicking Verify Connection. This sends a test message to all email addresses in the group.
For more information on setting up email groups for alerts, see Using Email Groups.
Incorrect "From" Address On Alert Notifications
Email alert notifications are being sent using the default From email address (alert_notification@akana.com) if the default has not been modified.
Solution:
Configure the from address.
To configure the "From" address for alert emails
- Log in to the Akana Administration Console for the Policy Manager instance.
- Click the Configuration tab.
- In the Configuration Categories section on the left, choose com.soa.console.
- Add the following property: email.sender.
- For the property value, type the email address that should display in the From field for alert messages sent out by Policy Manager. Click Apply.
- Click Apply Changes.
Note: The new setting takes effect after a short delay. You do not need to restart the container.
If you remove this property, the From address reverts to the default after the next restart of the Policy Manager container.
CA Revocation Emails not Being Sent
If CA revocation emails are not being sent, one possible cause is that the SMTP server isn't configured for the Certificate Authority.
Solution:
In Policy Manager, configure the SMTP server for the CA.
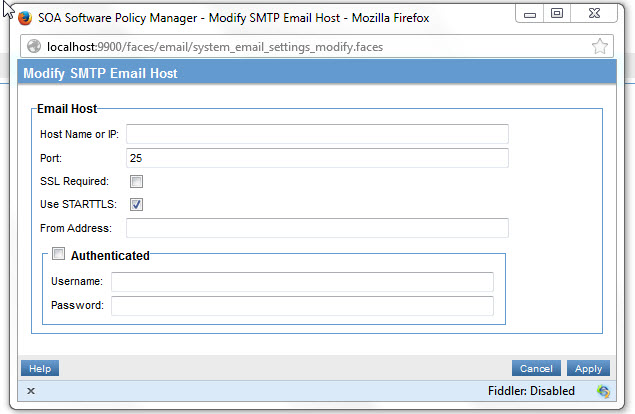
To configure the SMTP server for the certificate expiration email
- Log in to Policy Manager.
- Click the Configure tab.
- Click Email.
- Click Modify SMTP Email Host.
- Set the applicable values and save changes.
Alerts Not Showing Up on the Workbench
If expected alerts are not showing up on the Workbench, it might be because alerts are backlogged.
By default, Policy Manager is set to process up to 20 alerts per minute.
If the number of alerts being generated exceeds Policy Manager's capability to process them, the alerts will backlog in Policy Manager. This can result in important information not reaching the right individual quickly enough; it can also result in alerts being irrelevant or even misleading due to being out of date.
Solution:
If the alerts are backlogged because the normal volume is higher than 20 per minute, you'll need to contact the Administrator of the Akana Administration Console for the Policy Manager instance, who can implement one or both of the following:
- Increase the number of alerts Policy Manager can process per minute.
- Delete backlogged alerts from the database.
For instructions and additional information, refer to Alert Emails Not Being Sent later in this section.
Alert SMTP Server Not Set Up
You can set up SMTP messaging to email the following notifications to users:
- Alert notifications
- Certificate expiration notifications
- Out of memory errors on the error log
When adding or modifying an email group, you must specify the SMTP server used to send the emails for that group. You can verify the email setup by sending a test email to all addresses within the group. Follow the steps below.
To send a test email for an email group
To send a test email to all addresses within the group, click Verify Connection under the Authenticated box. The test email is sent immediately.
To configure Policy Manager to send certificate expiration notifications
- Log in to the Policy Manager console.
- Click the Configure tab and then click Email.
- Click Modify SMTP Email Host.
Certificate expiration notifications can be configured in the Policy Manager management console under Configure > Email > Modify SMTP Email Host, as shown below.
To configure Policy Manager to send email alert notifications to group members
- Log in to the Policy Manager console.
- Click the Alerts tab and then click Email Groups.
- Add a new email group, or modify an existing email group.
- In the Email Group overlay, add, update, or verify the email group details, including host information.
- Click Verify Connection. The Alert Manager sends a test email to the addresses defined for the email group.
- Conditional: If there is an issue, the emails are not sent out, and you will see an error message. Resolve as needed, and then try again.
To send alerts with a specific FROM: address
You can configure your alert emails to display a specific address in the From field on the email. Follow the steps below.
To set up a specific "From" address for alert emails
- Log in to the Akana Administration Console for the Policy Manager instance.
- Click the Configuration tab.
- In the Configuration Categories section on the left, choose com.soa.console.
- Add the following property: email.sender.
- For the property value, type the email address that should display in the From field. Click Apply.
- Click Apply Changes.
Note: The new setting takes effect after a short delay. You do not need to restart the container.
If you remove this property, the From address reverts to the default, alert_notification@akana.com, after the next restart of the Policy Manager container.
Unable to Start a Container
If the container will not start, it could be because of one of the following reasons:
Incompatible JRE Version
If the JRE version is incompatible with the Policy Manager version, the container will not start.
Note: Akana Container Instances created prior to Policy Manager Update 6.0.4.3 cannot run with Java 6.
Solution:
Verify that the JRE and update you are using are supported by the installed version of Policy Manager. Compatibility information is available in the installation documentation and on the support site.
Cannot Bind to an Interface
It might be that there is an issue with binding to a virtual machine interface, and the container is not listening on the expected host/IP and port.
If the container is being run on a machine with multiple interfaces, it might be necessary to bind a particular host/IP and port to a specific interface.
Solution:
To ensure the container listens on the specified interface, ensure that the bind to all interfaces option for the container listener in the Policy Manager console is not checked.
To resolve this issue, follow the steps below.
To clear the "Bind to All Interfaces" setting
- Log in to the Policy Manager console.
- For all affected containers, do the following:
- From the organization tree, select the container.
- In the center pane, under Inbound Listeners, in the Actions drop-down list, select Modify Container Listener. The Configure HTTP Container Listener overlay opens.
- Clear the Bind to all interfaces checkbox and then click Finish.
- Unregister the service using /sm60/bin/unregisterservice.bat.
- Re-register the service using /sm60/bin/registerservice.bat.
Cannot Start a Container After an Update
If there is an error when starting Policy Manager/Network Director containers installed as a Windows service, it could be because of installation or configuration issues.
Solution:
To troubleshoot this problem, follow the steps below.
- Run at command line—First, try starting the containers from the command line with this command:
start.bat {container}Based on the results, determine the next step:
- If it runs from the command line: the problem is an issue with the Windows service. Go on to the next step to reinstall the service.
- If it does not run from the command line: the issue is with the container itself. The container might be trying to bind to a network interface that it cannot bind to. If so, because you can't start Policy Manager, you must edit the system.properties file. Go to To clear the Bind to all interfaces setting in the system.properties file below. Use netstat to verify this.
- Reinstall Windows service—If the container doesn't start from the command line, you'll need to reinstall the Windows service. To do this, first unregister the service and then register it again. Using the script in the /sm60/bin folder, run the following commands:
UnregisterContainerService.bat {container_name}RegisterContainerService.bat {container_name}
To clear the Bind to all interfaces setting in the system.properties file
- Open up the system.properties file: /sm60/instances/ {PMcontainerName}/system.properties.
- Find the following default property:
com.soa.http.bind.all=true
If the property doesn't exist, add it.
- Set the value for this property to false.
- Save and exit.
Note: This property is typically modified if you have trouble connecting to the container listener. Another scenario where this might occur is if the machine has been assigned two different IP addresses. In this case, you must set the property to false. If you don't, the container Java process will bind to both IP addresses and be accessible on both addresses.
Troubleshooting Issues: Policy Manager Administrator
This section provides information about issues a Policy Manager Administrator might encounter. It includes:
- Alert Emails Not Being Sent
- Error message: "Unable to load the Service Descriptor Document file/s from the path mentioned. Recursion Depth Exceeded"
Alert Emails Not Being Sent
If alert emails are not being sent out, it might be because of one of the following:
- Too many alerts pending. By default, Policy Manager is configured to process 20 alerts per minute.
- SMTP settings are not configured properly.
- The Emails (EMAIL_TO) parameter is missing for the email group.
Solution:
To clear the backlog of pending alert emails, run the following database query:
update AM_ALERTDISPSTAT set lastalertsid = (select max(alertsid) from am_alerts)
In addition, if the issue was not caused by an abnormal spike in alerts, you'll need to increase the number of alerts Policy Manager can process per minute.
To increase the number of alerts Policy Manager can process per minute
- Log in to the Akana Administration Console for the Policy Manager instance.
- Click the Configuration tab.
- In the Configuration Categories section on the left, choose com.soa.framework.
- Add the following property:
number.of.alerts.to.dispatch.in.one.run
- Set the value to 1000.
- Save changes. Container restart is not required.
The Emails (EMAIL_TO) or SMTP email host is missing for the email group
If an email notification is not received for certificate expiration, it might be because the EMAIL_TO parameter or SMPT email host is not being configured.
Solution:
If you find alert code 512308, you must configure the EMAIL_TO parameter or an SMTP email host to receive certificate expiration alerts. For more information, see Setting up an SMTP email host or Configuring email group and alert code.
Error message: "Unable to load the Service Descriptor Document file/s from the path mentioned. Recursion Depth Exceeded"
Valid in version: 2020.2.18 and later
If you are setting up a REST service in Policy Manager, and the service descriptor document has many levels of recursion, you might see this error message:
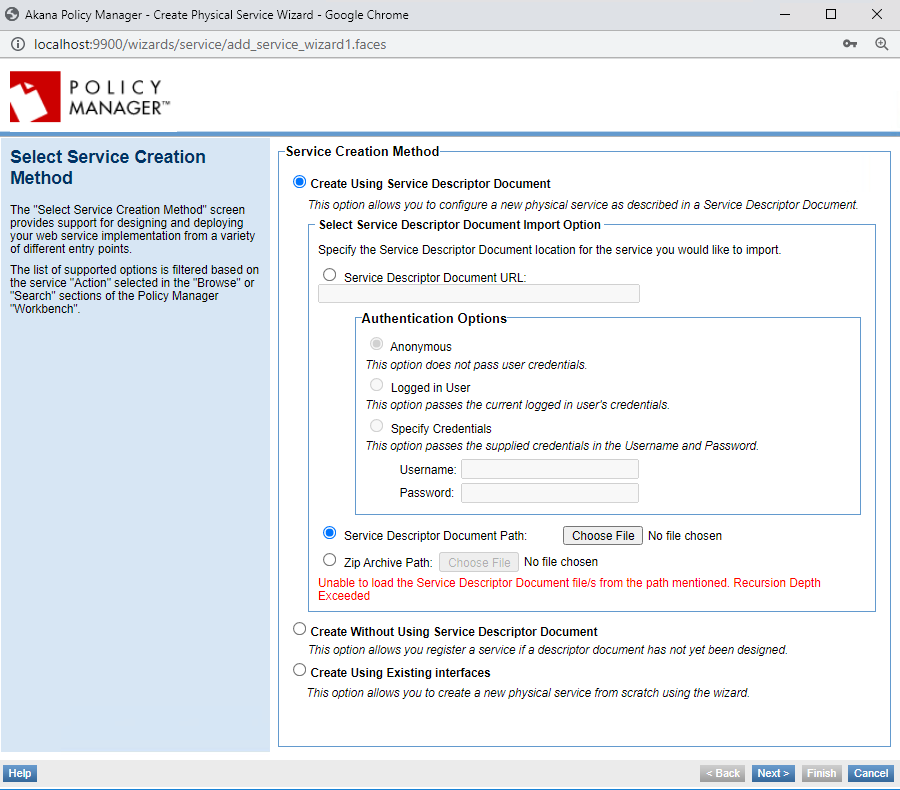
Solution:
There is a configuration property that you can adjust to increase the number of levels for which recursion is allowed. The default is 10. If you increase the value to the number of recursion levels in the document, the error will not occur and the document will load.
Note: Increasing the default level might have an impact on performance in dealing with large APIs. An alternative approach is to request redesign of the API description itself. If necessary, you could also increase the value of the property to allow creation of a specific service, and then change the property back to the original setting.
To increase the number of recursion levels allowed in an API description document
- Log in to the Akana Administration Console for the Policy Manager instance.
- Click the Configuration tab.
- In the Configuration Categories section on the left, choose com.akana.swagger.
- In the right panel, modify the value of the swagger.config.maxDepth property, shown below, from the default of 10 to a greater number, such as 20.
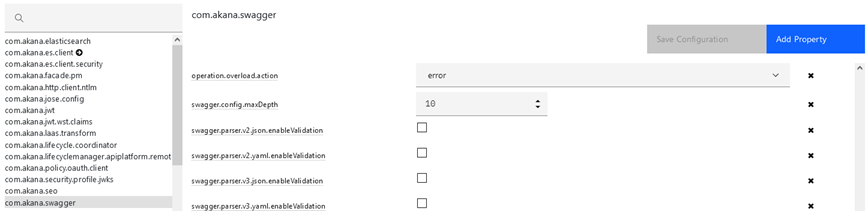
- Save changes.
Note: The settings take effect immediately. You do not need to restart the container.
Miscellaneous Items
This section includes:
- HTTPS Listener Not Listening
- Out of memory errors on the error log
- Containers Not Starting After Update
- Cannot Log In to Policy Manager Console using LDAP
- Checking the JRE version
HTTPS Listener Not Listening
If the HTTPS listener is not listening on the Policy Manager container, it might be because the HTTP listener is not configured with applicable security.
All HTTPS listeners must be configured with PKI keys and X.509 certificate. If they are not, they will not work.
Solution:
Verify that the HTTPS listener is correctly configured, using the instructions below. If needed, take further troubleshooting steps as explained in the second procedure below.
To verify that an HTTPS listener is configured with PKI keys and X.509 certificate
- Log in to the Policy Manager console.
- Under the organization tree on the left, select the container for the HTTPS listener.
- In the right pane, click the Details tab.
- Under Inbound Listeners, on the Actions drop-down list, choose Modify Container Listener.
- Under PKI Key Details and Certificate Details you should see the base64 encoded public key and the details of the X.509 certificate. If they are not present, generate PKI keys and X.509 certificate and add them.
To troubleshoot issues with the listener not working
- On the machine on which the container is hosted, verify that the container is listening on the configured port and there are no other processes configured to listen on the container port. Shut down the container and verify that there is no process running that is listening on the same port as the configured container. For example, you could use a tool such as netstat.
- Verify that the listener's container is started.
- Check the logs of the container.
Out of memory errors on the error log
Out of memory errors in the log file for the container indicate that the container does not have enough memory reserved.
Solution:
If you find that you need more memory than the default of 1GB, you will need to convert to 64- bit JRE before increasing the memory. For instructions, see below.
Note: Before you convert, check with Support to see which JRE update is supported with Policy Manager (see Customer Support or check the System Requirements document for your version).
To convert to 64-bit JRE
If Policy Manager and Network Director are installed as a Windows service, uninstall them before following the procedure below. Use the uninstall batch file: \sm60\bin\UnRegisterContainerService.bat.
- Download the JRE 1.6 64-bit version from the Oracle website. Use one of the following:
- For Linux: Linux-64bit-jre-1.6.0_37
- For Windows: Windows-64bit-1.6.0_32
- Install the JRE into a separate directory on the Policy Manager or Network Director machine. It can be in any location.
- Copy the bcprov-jdk15-141.jar file from the original PM ./sm60/jre/lib/ext directory to the Java 6 ./jre/lib/ext directory.
- Edit the {Java6_install_location}/jre/lib/security/java.security file to add the following security provider:
security.provider.9=org.bouncycastle.jce.provider.BouncyCastleProvider
- Rename the current ./sm60/jre directory to ./sm60/jre_15.
- Copy the {Java6_install_location}/jre directory into the Policy Manager or Network Director ./sm60 directory tree (./sm60/jre).
- Edit the /sm60/bin/startup.sh or startup.bat file to make the change shown below:
- From: JAVA_OPTS="-Xmx1024M -XX:MaxPermSize=128M"
- To: JAVA_OPTS="-Xmx2048M -XX:MaxPermSize=256M"
- On Windows, edit the /sm60/bin/RegisterContainerService.bat file to make the change shown below:
- From: JAVA_OPTS=-Xmx1024M -XX:MaxPermSize=128M
- To: JAVA_OPTS=-Xmx2048M -XX:MaxPermSize=256M
- In the \sm60\bin folder, rename JavaService.exe to JavaService32.exe.
- Copy JavaService64.exe (you can request it from Akana Technical Support) to \sm60\bin and rename it to JavaService.exe.
- Edit the \sm60\bin\RegisterContainerService.bat file to make the change shown below:
- From: SET JAVA_DLL="%JAVA_HOME%\bin\client\jvm.dll"
- To: SET JAVA_DLL="%JAVA_HOME%\bin\server\jvm.dll"
Note: We recommend that you use 2GB of memory when using 64-bit JRE. If you have a large deployment with many concurrent requests and many hosted services in the Network Director, you might need a larger heap size.
Containers Not Starting After Update
A likely cause for this issue is that the configurator cache was not cleared before the update.
Solution:
It's important that the configurator's cache folder is cleared before updating Policy Manager. If the container doesn't start after an update, and you determine that the update was started without first clearing the configurator cache, contact Akana Technical Support for assistance (see Customer Support).
Cannot Log In to Policy Manager Console using LDAP
If you're experiencing trouble logging in, you will first need to determine whether you have connectivity with the LDAP server. If you do, there might be such a high volume of calls that it isn't readily available. If this is the case they you will need to define a failover server.
Solution:
To check connectivity, first try logging in on the local domain. To do this, switch your domain to localdomain and then log in using the localdomain Admin ID.
If needed, define one or more failover LDAP servers. Follow the steps below.
To define a failover LDAP server
- Log in to the Policy Manager console.
- Click the Configure tab and then click Security.
- Click Identity Systems, and then click Modify Identity System.
- Add failover URLs and save changes.
Checking the JRE version
If you have an existing installation and you're not sure which JRE version the platform is using, you can check it in either of these ways:
- In the Akana Administration Console > System tab > System Properties section, find the java.runtime.version property. The property value is the JRE version.
- If you have your PATH set to include the correct JAVA_HOME: At the command line, type java -version.


