Monitoring APIs with the My Dashboard Feature
Monitor up to 10 APIs for which you're an API Admin, using the My Dashboard feature.
Valid in Version: 2020.1.0 and later.
Table of Contents
- What is the My Dashboard feature?
- What API data can I see on the My Dashboard feature?
- Which users can add an API to the My Dashboard feature?
- How do I get to the My Dashboard feature?
- How do I add an API to the My Dashboard feature?
- How many APIs can I have on the My Dashboard feature?
- How do I remove an API from the My Dashboard feature?
- How do I use the My Dashboard feature?
What is the My Dashboard feature?
The My Dashboard feature allows you to monitor up to 10 APIs for which you have the API Admin role. You can add them to a visual API metrics summary display so that you can more easily monitor API activity.
Here's how it works:
- First, in the APIs List, you choose which APIs to add to the My Dashboard.
- Then, in the My Dashboard display, you can review metric information for the APIs you chose. An example is shown below.
The My Dashboard display includes tools to help you narrow down the information you want to see. For details, see How do I use the My Dashboard feature?
What API data can I see on the My Dashboard feature?
The My Dashboard feature summarizes these metrics for each of the APIs you add to it:
- Throughput: The number of messages processed during one data point increment.
- Request Size: The average request size for the API (total size for each request / number of requests), during one data point increment. The unit of measure is indicated—for example, B for bytes or KB for kilobytes.
- Response Time: The average response time for the API, in milliseconds (total response time for each transaction / number of transactions) during one data point increment.
Data representation on the chart:
- The number of data points is determined by the selections for Duration and Interval. For the default duration of 1 hour and interval of 1 min, there are 60 data points on the chart, each one summarizing information for the preceding one-minute period.
- Information is averaged for the entirety of each data point. For example, let's say the Duration is 1 day and the Interval is 15 mins. Activity starts at 12:05 and runs at 30 transactions per 15 minutes. Although the level of traffic is steady, the chart shows a lower activity level for the first 15-minute increment, because there are only 20 transactions in the 15-minute period (12:05–12:15).
Which users can add an API to the My Dashboard feature?
To be able to add an API to the My Dashboard, a user must be logged in to the Community Manager developer portal and have one of these roles:
- API Admin: The user who created the API, or a user who was invited to the API Admin group and accepted the invitation.
- Business Admin: The Business Admin role has API Admin rights for all APIs in the organization.
A user who is following an API, or has an app contracted to the API but is not an API Admin, cannot add the API to their My Dashboard.
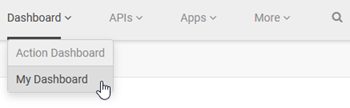
How do I get to the My Dashboard feature?
The My Dashboard feature is available from the top navigation bar in Hermosa Theme.
Navigation: Dashboard > My Dashboard.
How do I add an API to the My Dashboard feature?
There are two ways you can add an API to the My Dashboard feature:
To add an API to the My Dashboard feature from the My APIs list
Go to APIs > My APIs. The My APIs list appears.
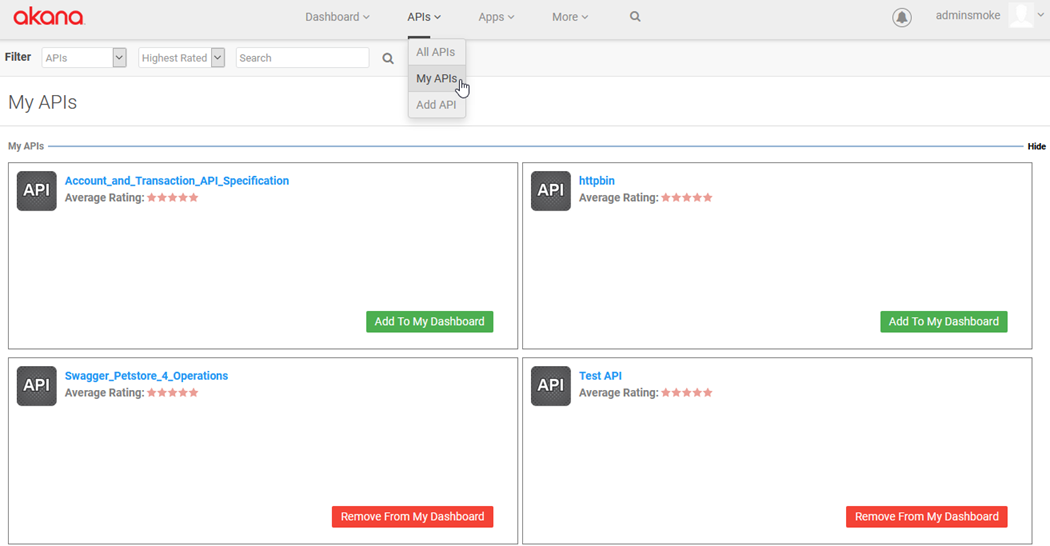
To add an API to your My Dashboard page, click Add to My Dashboard. Then view the updates: see How do I use the My Dashboard feature?
To add an API to the My Dashboard feature from the API Overview page
- Log in to the Community Manager developer portal.
- Go to the Overview page for the API. For an example, see How do I manage my API?
- At the top right, click Add to My Dashboard.
How many APIs can I have on the My Dashboard feature?
The default platform setting allows you to have a maximum of 10 APIs on the My Dashboard feature.
This default value is configurable by the Site Admin. In some cases, you might find that the maximum number is lower.
If you want to add an API, and you reach the maximum, you'll see a warning message. In this case, you'll need to remove another API from your list before adding the new one.
For more information about the platform setting, see How do I configure settings for users? (Site Admin help).
How do I remove an API from the My Dashboard feature?
To remove an API from the My Dashboard feature, do one of the following:
- Go to APIs > My APIs, find the API on the list, and click the Remove from My Dashboard button.
- Go to the Overview page for the API and click the Remove from My Dashboard button.
Then view the updates: see How do I use the My Dashboard feature?
How do I use the My Dashboard feature?
You can use the My Dashboard feature to view the following analytics information, in chart format, for your favorite APIs:
- Throughput
- Request Size
- Response Time
By default, chart information is displayed for:
- All APIs added to the My Dashboard
- Duration: 1 hour
- Interval: 1 min
You can remove one or more of the APIs on the My Dashboard from the chart, and you can change the duration/interval settings. The number of data points on the graph is determined by the duration/interval combination.
To use the My Dashboard feature
- Log in to the Community Manager developer portal and go to Dashboard > My Dashboard.
- If needed, use the controls at the top to define the time frame to be shown on the chart:
- Duration. Controls the time period to be shown on the chart. You can choose to show the last: 5 Minutes, 15 Minutes, 1 Hour, 1 Day, 1 Week, 1 Year.
Default: 1 Hour.
- Interval: The time interval determining the data points on the chart. Options adjust based on the value for Duration. For example, if Duration is 5 minutes, Interval is 5 sec. If Duration is 1 year, Interval is 1 week.
For specific options, see Duration and interval options below.
- Duration. Controls the time period to be shown on the chart. You can choose to show the last: 5 Minutes, 15 Minutes, 1 Hour, 1 Day, 1 Week, 1 Year.
- If needed, remove one or more APIs so that the rest of the information is easier to see. There are two ways to do this:
- Top checkboxes: Clear the checkbox for one or more of the API names displayed at the top of the page, and then click the Refresh icon at the top right to remove them from the chart. The data display is refreshed, and the chart shows only the remaining APIs.
- Side legend: Click one or more of the API names displayed to the right of the chart to remove them from the display. Note that with this method, the data display is not refreshed.
Note: To remove an API completely from the My Dashboard feature, go to the My APIs page, or the API Overview page, and click Remove from My Dashboard.
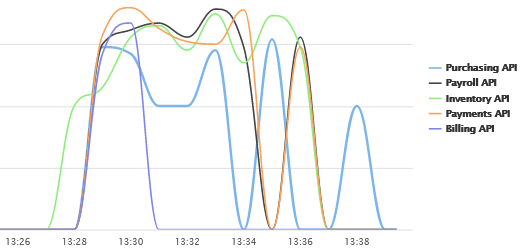
- Scroll down the page to view the three charts. For details on each chart, review the sections below:
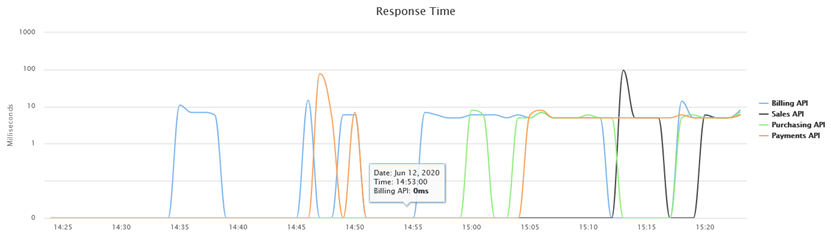
- If needed, hover over specific points on the chart to see transaction detail. An example is shown below.
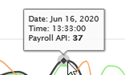
Note: To view details of specific transactions, or save transaction information to an external file, use the API Analytics features. See Monitoring API Analytics.
Duration and interval options
The options available for duration and interval selections are shown below.
| Duration | Interval | Number of data points |
|---|---|---|
| 5 minutes | 5 sec | 60 |
| 15 minutes | 15 sec | 60 |
| 1 hour | 1 min | 60 |
| 1 day | 15 min | 96 |
| 1 day | 1 hour | 24 |
| 1 week | 1 hour | 168 |
| >1 week | 1 day | 7 |
| 1 year | 1 week | 52 |
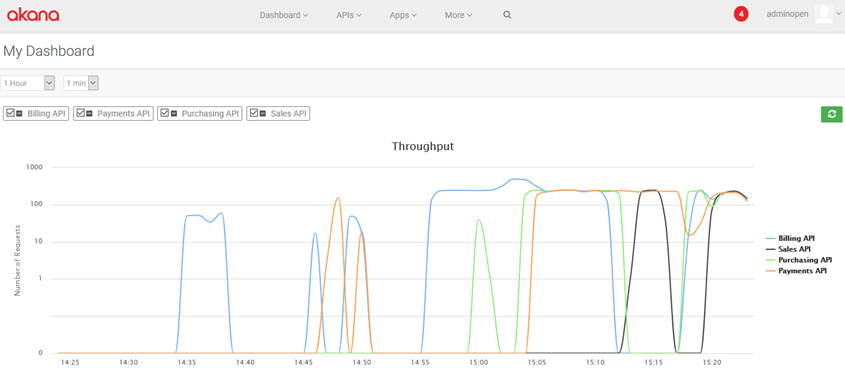
Viewing the Throughput Chart
This chart offers a visual display of the total number of transactions (throughput), for the specified time period, for APIs on the My Dashboard.
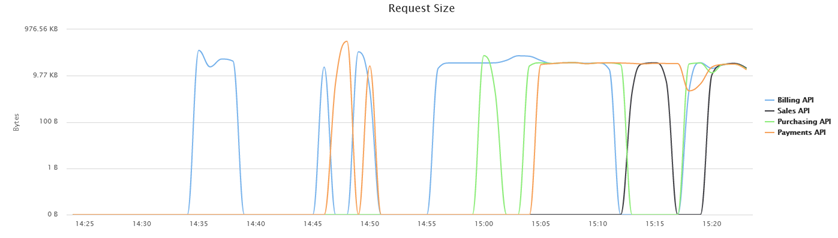
Viewing the Request Size Chart
This chart offers a visual display of average message size, for the specified time period, for APIs on the My Dashboard.
Viewing the Response Time Chart
This chart offers a visual display of average response time, for the specified time period, for APIs on the My Dashboard.