Monitoring API Analytics
Use analytics to monitor your API's performance.
Analytics information is available:
- For APIs via APIs > My APIs > choose API > Analytics.
- For apps via Apps > My Apps > choose app > Analytics.
The information on the Analytics pages is very similar for both apps and APIs, but there are some differences. For example, certain information is only available in the API charts.
Video content: Learn how to use Akana to monitor your APIs for performance, availability, and proper function.
Note: You can also create a high-level view of your favorite APIs using the My Dashboard feature. See Monitoring APIs with the My Dashboard Feature.
Table of Contents
- What API analytics information is available?
- How can I see an overview of my API's performance?
- What information can I see on the API Charts page?
- What information can I see on the API Logs page?
- What information can I see on the API Licenses page?
- Who can see my API's performance metrics?
- How do I monitor my API's performance for a specific app/API contract?
- Why is some of my analytics information missing?
What API analytics information is available?
The platform includes a number of charts and logs to help you monitor your API's performance from different views. Chart data can be used to monitor API usage over time or to troubleshoot errors with API operation. Usage logs that include request and response message data for API, App, and Contract activity can be queried and viewed.
Note: To gather detailed analytics info, you'll need to make sure the Detailed Auditing policy is attached to the API. See Why is some of my analytics information missing?
Go to: APIs > My APIs > choose API > Analytics.
The options available are summarized in the table below.
| This option... | Shows this information... |
|---|---|
| Overview |
Charts:
Additional charts available for APIs only:
For more information, see How can I see an overview of my API's performance? and What information is shown on the Top Contributors chart? |
| Charts | Performance charts. See What information can I see on the API Charts page? |
| Logs | Transaction logs. See What information can I see on the API Logs page? |
| Licenses |
Charts for licenses:
For more information, see What information can I see on the API Licenses page? |
How can I see an overview of my API's performance?
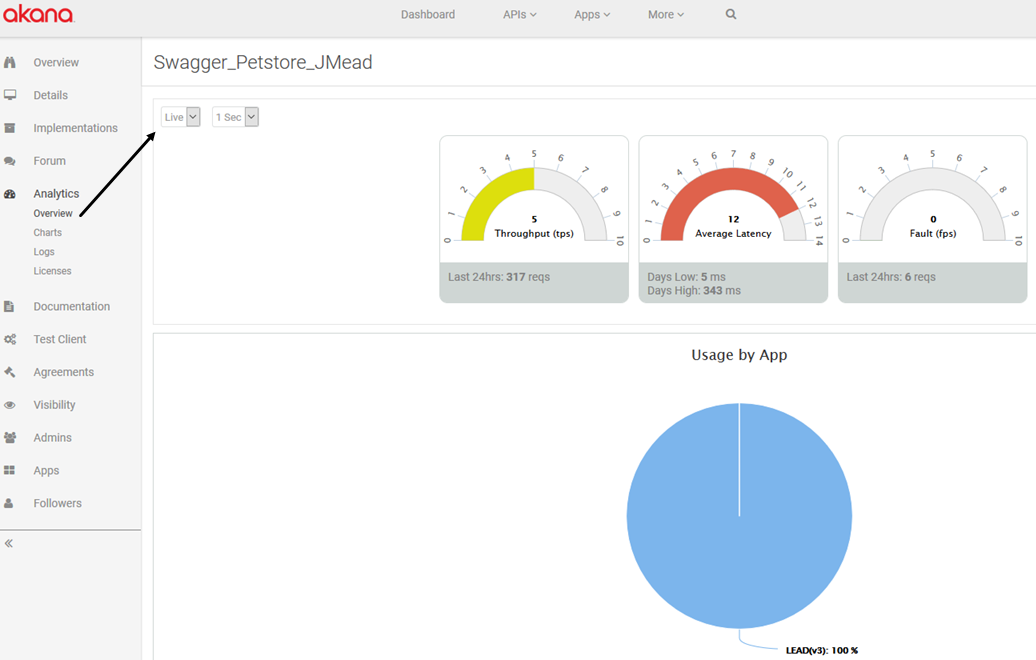
The API Analytics Overview page presents a summary view of your API's performance.
Go to: APIs > My APIs > choose API > Analytics > Overview.
An example is shown below. The main sections, present when viewing analytics information in the context of either an API or an app, are:
- The visual dials at the top of the page summarize activity. See API Analytics Overview dials.
- The next section shows the Usage by App breakdown, as a pie chart.
- Additional charts, depending on the data set: for example, the Usage by Operation pie chart, shown below.
Additional charts available only when viewing analytics in the context of an API, not an app:
- Geographical Distribution (of API usage for the past week)
- Usage by App
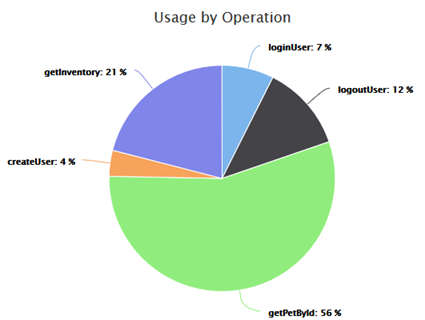
- Usage by Operation (shown below)
- Top Contributors: see What information is shown on the Top Contributors chart?
Usage by Operation chart:
Note: This chart is only available in API Analytics. The App Analytics section does not include Usage by Operation.
API Analytics Overview dials
The API Analytics Overview section includes a set of barometer-style dials to give you an overview of your API's throughput, latency, and success rate.
You can narrow down the data by the following:
- Implementation: Sandbox or Live
- Interval: 1 Sec or 1 Min
An example is shown below.
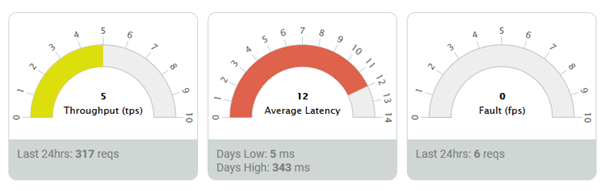
The API Analytics Overview dials give a summarized data representation of the following:
- Throughput (tps): Summarizes maximum throughput per second over the last 24 hours, and the total number of requests.
- Average Latency: Provides low and high message latency values, in milliseconds.
- Fault (fps): Summarizes the number of fault messages per second in the specified period.
What information is shown on the Top Contributors chart?
The API > Analytics > Overview page includes several charts. The last one on the page is the Top Contributors chart, which gives a visual representation of which users contributed most to the API Forum (API > Forum) with discussions and comments.
An example is shown below.
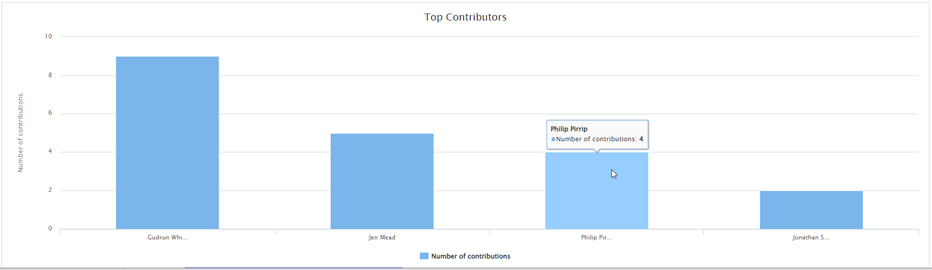
Information is only reflected in this chart if Discussions and/or Tickets (one or more) have been created in the API Forum. If there is no discussion, this chart is not displayed.
What information can I see on the API Charts page?
You can use performance charts to monitor API usage over time or to troubleshoot errors.
The Charts page allows you to set criteria and view activity on three charts. You can also query usage and performance data in the Logs section on the same page. For more information about the logs, which you can also see on a separate page, see What information can I see on the API Logs page?
Go to: APIs > My APIs > choose API > Analytics > Charts.
In this section:
- API Charts: Data set
- API Charts: Types
- API Charts: Filters
- API Charts: Using Zoom
- Exporting API charts
- Viewing logs on the Charts page
API Charts: Data set
You define the data set represented in the chart by using the filters as needed to specify implementation, app, duration, and time range, as covered in API Charts: Filters below.
However, charts are populated from usage "roll-up" data that is gathered during message processing. The platform matches the roll-up data sets that most closely match the values specified. For example, if the current time is 17:35 and you choose a duration of 1 day and an interval of 15 mins, the chart shows data from 18:00 the previous day to 18:00 on the current day.
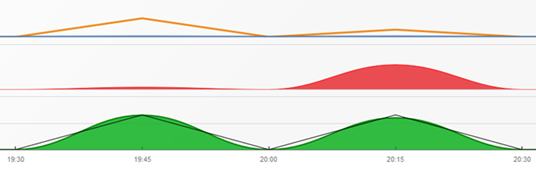
API Charts: Types
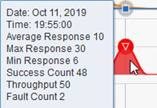
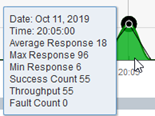
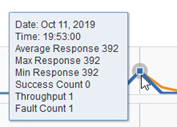
A sample chart is shown below.
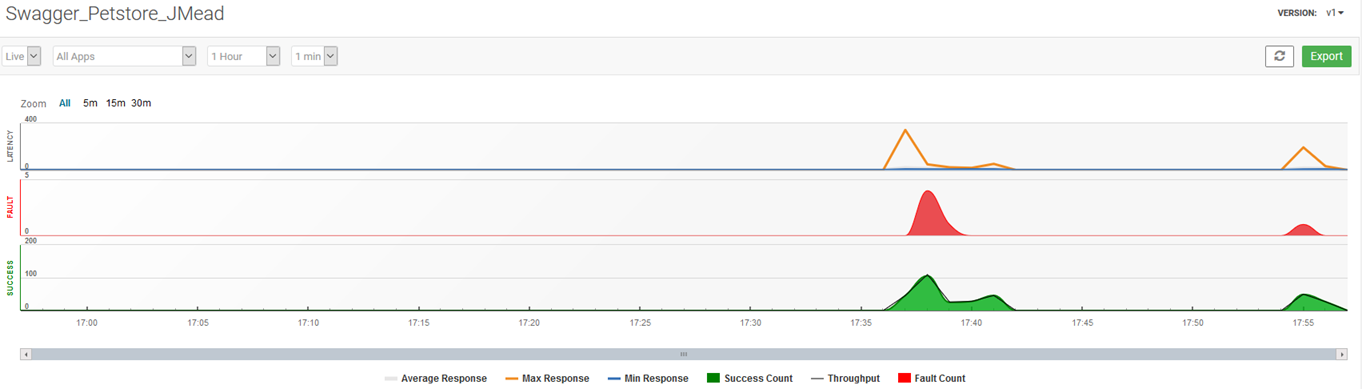
There are three charts. Hover over any data point in any of the charts to view detail including Date, Time, Average Response, max Response, Min Response, Success Count, Throughput, and Fault Count. All chart data is in milliseconds (ms).
| Chart | Description | Example |
|---|---|---|
| Latency |
Summarizes latency as a line over the time period. Drag and drop using the mouse to zoom or move on the chart. |
|
| Fault |
Shows fault messages. Drag and drop using the mouse to zoom or move on the chart. |
|
| Success |
Shows success messages. Drag and drop using the mouse to zoom or move on the chart. |
|
API Charts: Filters
On the Analytics > Charts page, you can filter by:
- Implementation (Live or Sandbox)
- All apps or a specific app that is contracted with the API.
- Duration. Controls the time period to be shown on the chart. You can choose to show the last: 5 Minutes, 15 Minutes, 1 Hour, 1 Day, 1 Week, 1 Year.
- Interval: The time interval determining the data points on the chart. Options adjust based on the value for Duration. For example, if Duration is 5 minutes, Interval is 5 sec. If Duration is 1 year, Interval is 1 week.
Chart data is presented based on the selected Duration and Interval, which together represents the total time range displayed.
API Charts: Using Zoom
When you've defined the data set you want to view, using the filters, there are a couple of other ways you can narrow down the information you need:
Zoom feature
The zoom feature is below the filters. An example is shown below.
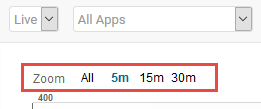
Here, you can narrow down the data set that's shown in the chart.
Time increments on the Zoom feature work together with the Duration setting. For example, if Duration is 1 Hour, the Zoom increments are All, 5m, 15m, and 30m, as shown above. If Duration is 1 Day, zoom increments are All, 1h, 3h, 6h, 12h.
Zooming with the mouse
You can zoom with the mouse on a specific area of data in the chart, to examine it more closely.
Place the mouse on one side of the area, then drag to the other side and let go of the mouse, as shown below. The area you defined is enlarged on the chart.
| Steps 1 and 2: Click on one side, then drag to the other side. | 1) 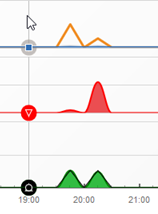 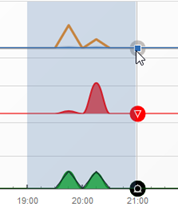 |
| Step 3: Release to enlarge |
|
Refresh
After zooming in, click the Refresh icon at the top left to:
- Reset the zoom settings on the chart. Filter settings are preserved.
- Refresh the chart data, based on the selected Duration and Interval, which together represent the total time range displayed.
Exporting API charts
As well as viewing charts, you can export usage data to a .csv file.
Click the Export button at the top right, and choose the file location. The file is named export.csv.
To export charts
- Go to APIs > My APIs > choose API > Analytics > Charts.
- Set the filters as needed to define the data set that you want.
- On the right, click Export. The Opening export.csv dialog box displays.
- Choose whether to open or save the file:
- To open, choose Excel or specify another program, and then click OK.
- To save, click OK and specify the download location.
Note: You can also export logs. See below and Exporting API logs.
Viewing logs on the Charts page
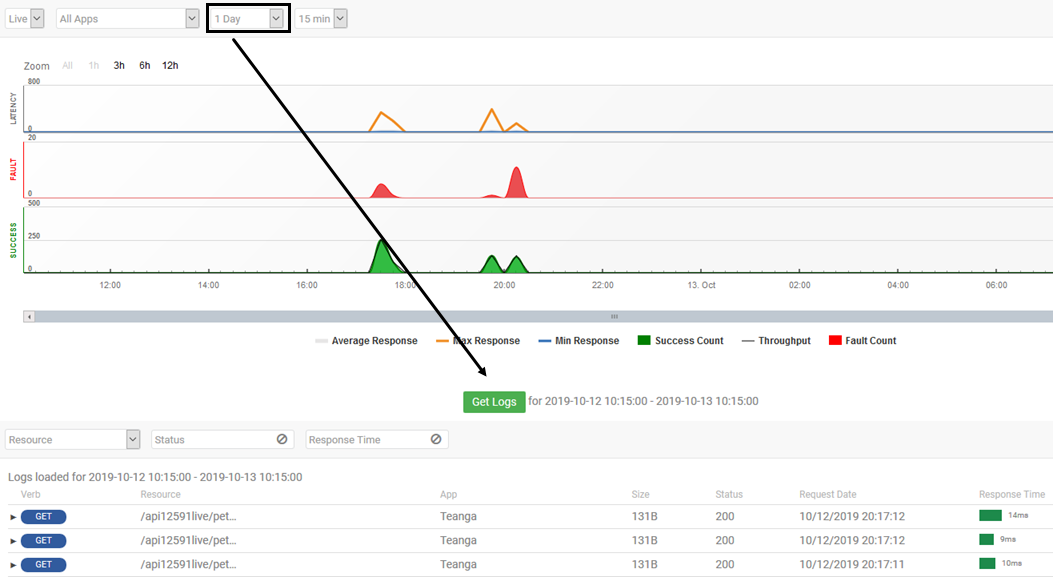
From the Charts page, after setting criteria and/or using the Zoom feature, click Get Logs to view the logs.
Notes:
- When you change the criteria, the chart refreshes immediately, but the logs do not. After changing criteria, click Get Logs to refresh the logs list.
- By default, the logs represent information to the end of the specified interval. In the example below, the interval is 15 min, so the logs include data to the end of the specified 15-minute period.
What information can I see on the API Logs page?
You can use the Logs page to review details of your API messages. There is a log entry for each message, summarizing message detail such as HTTP verb, resource, app, and message time stamp.
Go to: APIs > My APIs > choose API > Analytics > Logs.
You can:
- View the logs: see Viewing the logs summary
- Filter the list: see Using filters on the logs list
- View details of a specific transaction: see View details
- Export the logs: see Exporting API logs
Viewing the logs summary
Logs are displayed in a table format, as shown below. Filters and other controls are above the list.
Using filters on the logs list
You can filter by:
- Implementation (Live or Sandbox)
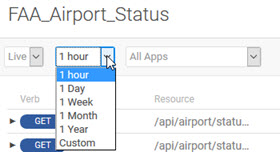
- Specifying how much data is shown: the last 1 hour, 1 day, 1 week, 1 month, 1 year, or a custom from/to range in HH:MM:SS values. For details, see Specifying a custom date range.
- All apps or a specific app.
- All resources or a specific resource (operation, method) that is part of the API.
- HTTP status: Select one, multi-select, or specify Success or Failure. For a full list, see Specifying HTTP status in the logs.
- Response time, in milliseconds. Specify less than, greater than, or a range.
Viewing details
Click the arrow to the left of a log entry to view the transaction detail, as shown below.
Note: the example below does not show TTFB metrics. See Viewing the time to first byte (TTFB) metrics.
Specific details vary according to the message; for example, whether it is a POST or a GET. You can:
- Click on any of the magnifying glass icons to view details:
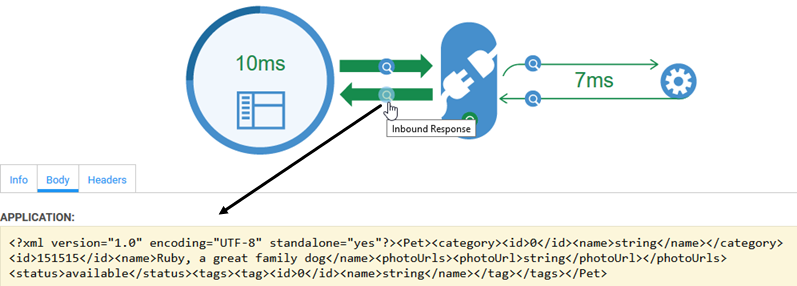
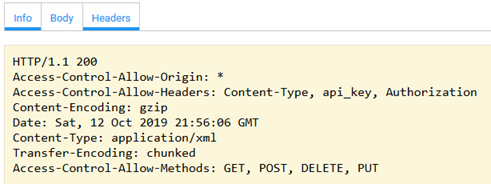
- Click Info, Body, and Headers tabs for more information. The example below shows the Headers tab. You might also see a Next Hop tab. See Additional information on the Next Hops tab.
Exporting API logs
As well as viewing logs, you can export usage data to a .csv file.
Click the Export button at the top right, and choose the file location. The file is named apilogs.csv.
Note: The export file is limited to a maximum of 10,000 records.
To export logs
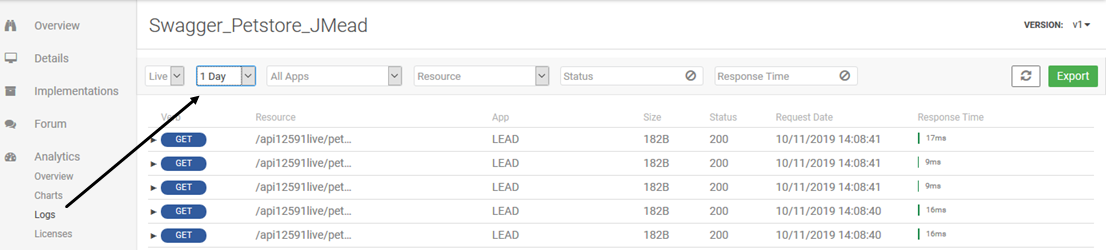
- Go to APIs > My APIs > choose API > Analytics > Logs.
- If applicable, change the default settings to narrow down the information you want to export. You can modify Implementation, Duration, and All Apps/specific app, as shown below.
- On the right, click Export. The Opening apilogs.csv dialog box displays.
- Choose whether to open or save the file:
- To open, choose Excel or specify another program, and then click OK.
- To save, click OK and specify the download location.
Note: You can also export chart info. Go to APIs > My APIs > choose API > Analytics > Charts, specify criteria, and click Export.
Specifying HTTP status in the logs
You can filter the logs by specific HTTP status values. Check all the boxes that apply.
You can choose:
- One or more HTTP codes out of the 200 series, 300 series, 400 series, or 500 series.
- Success (selects all 200-series HTTP codes) or Failure (selects all 400-series and 500-series HTTP codes).
Specifying a custom date range
If you have a lot of transactions, you can use the Custom date range option to narrow down the time period. Custom date range includes hours, minutes, and seconds, so you can narrow down your logs or license charts to a range of seconds, to help you zero in on specific transactions.
Note: If you use the Custom date range, the platform uses the time values from your local browser settings, converted to UTC time.
To specify a custom date range
- Go to APIs > My APIs > choose API > Analytics > Logs or APIs > My APIs > choose API > Analytics > Licenses.
- Choose the environment.
- Click the Interval drop-down and choose Custom.
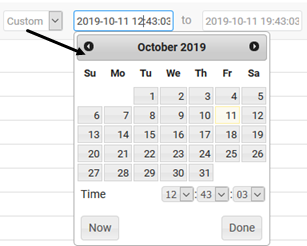
- Define start and end date/time, as shown below.
- Adjust the date range as needed until you have the transaction range you need. The list updates immediately.
Viewing the time to first byte (TTFB) metrics
Valid in Version: 2020.1.0 and later
In the Analytics > Logs page, you can view detailed information about the TTFB.
In this section:
- TTFB metrics
- Viewing the TTFB for a single proxied API call
- Viewing the TTFB for an orchestrated call
- Additional information on the Next Hops tab
- Message Properties
TTFB metrics
The metric breakdown for TTFB shows how long each hop takes. Rather than just showing the time from when the message is sent to when the response is received, the time is broken down into stages. TTFB metrics include the values listed below.
- Request Processing
- The time from when the Gateway receives the request to when the Gateway initiates the request to the next-hop service.
- During this time, the Gateway might be performing multiple activities: for example, retrieving public keys or certificates, validating OAuth tokens.
- Next Hop Response (TTFB)
- The time from when the Gateway sends the request to when the first byte of response is received. Includes request write time and time taken by the next-hop service.
- Response Processing
- The time from when the Gateway receives the response from the next-hop service to when the Gateway initiates writing the response (writes the first byte back to the client).
- Response Sent
- The time the Gateway takes to write the complete response to the client.
Viewing the TTFB for a single proxied API call
When you click the arrow to the left of a log entry to view the transaction detail, you can view all the metrics for the API call.
The first few metrics are a breakdown of TTFB, with bars illustrating the various steps, as shown below.
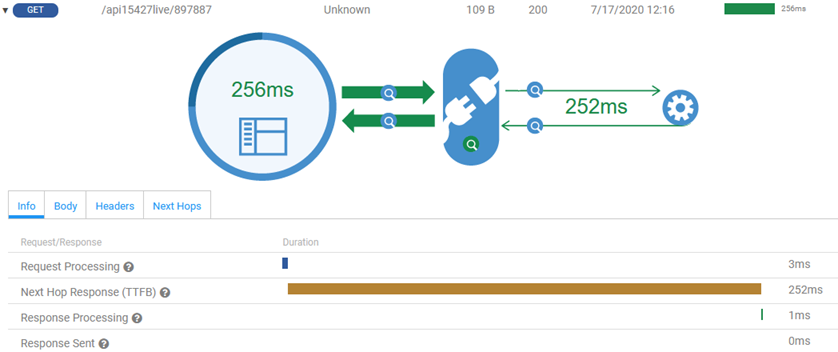
For information on additional message properties, see Message properties.
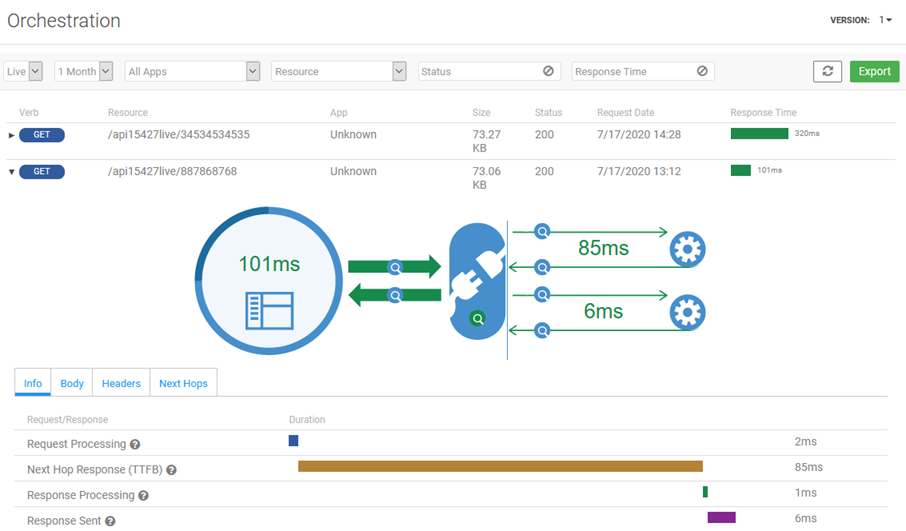
Viewing the TTFB for an orchestrated call
If your API uses orchestration, where preparing the response to one API call includes separate calls to more than one API, you can see the times for each hop in the API metrics.
In the example below, it's clear that the first hop takes a lot longer than the second. This information can be useful in debugging a more complex scenario.
Additional information on the Next Hops tab
If a message represents a call to an API operation that uses orchestration, there can be multiple hops. In this case, an additional tab, Next Hops, is available to give you an information breakdown for each hop, as shown below. This example is an orchestration, with two calls, so there are two sets of metrics.
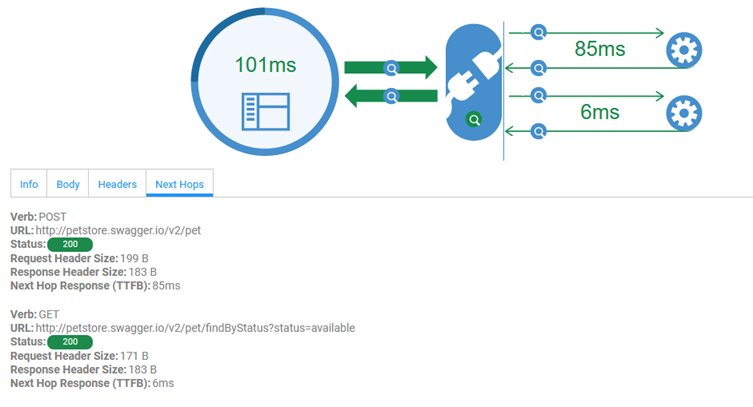
For each next-hop step, the tab displays the HTTP verb, URL, status, request header size, response header size, and next-hop response time (TTFB).
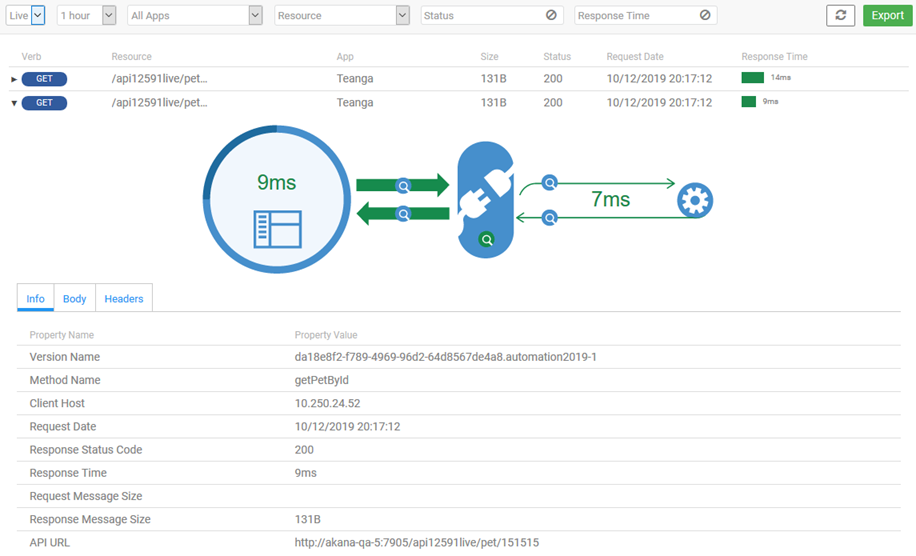
Message Properties
An example of the response properties is shown below, with field descriptions.
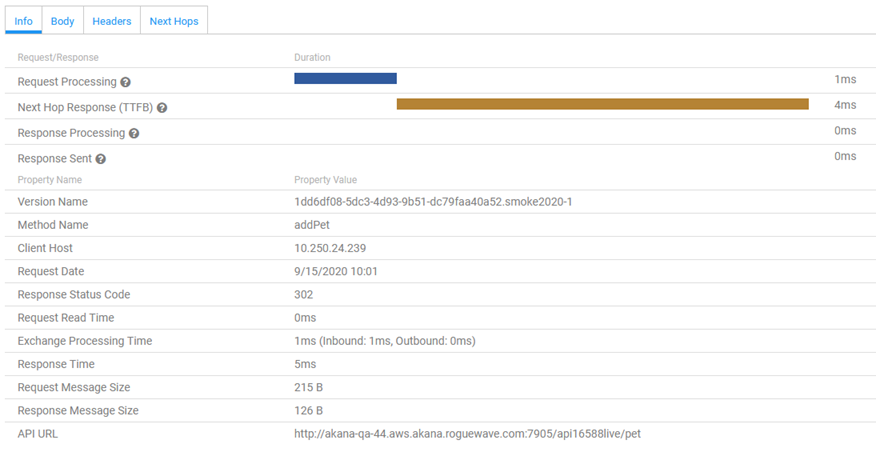
- Version Name
- The API version.
- Method Name
- The name of the API method (operation) being called.
- Client Host
- IP address for the client host.
- Request Date
- Timestamp for the request.
- Response Status Code
- HTTP status code for the response.
- Request Read Time
- The time taken by Gateway to read the request from the client.
- Exchange Processing Time
- The total time that the Gateway took to process the message: processing time for the inbound message (Request Processing time) plus processing time for the outbound message (Response Processing time). It is the total time that the message spent in the Gateway.
- Response Time
- The total time taken for the entire API call, from the receipt of the request until the sending of the last byte of the response.
- Request Message Size
- Size of the request message.
- Response Message Size
- Size of the response message.
- API URL
- The endpoint for the API.
What information can I see on the API Licenses page?
If your API is using the Licenses feature, you might want to monitor the API's performance for each license.
Go to: APIs > My APIs > choose API > Analytics > Licenses.
The platform includes a set of monitoring tools, including pie charts and bar charts, to help you monitor by license.
Three choices are available:
- API Usage by License
- API Usage by App
- API Quota Usage
From the API Details page, click Analytics on the left menu, and then click Licenses.
There are certain prerequisites that must be in place for monitoring information to be displayed correctly. Make sure:
- Your API is using the Licenses feature.
- Your licenses include a quota policy.
- Your time zone is set correctly in the configuration settings for the underlying infrastructure (configuration settings, com.soa.rollup.configuration, monitoring.rollup.configuration.dailyRollupTimeZones setting). The time zone setting affects the way the data is rolled up into increments such as hour and day. If the settings are not correct, ask your Site Admin to adjust the time zone.
The options available are summarized in the table below.
| This option... | Shows this information... |
|---|---|
| API Usage by License |
Pie charts that breaks down the total traffic to the API by license. This shows which license is using which portion of the API, out of the total traffic. Pie charts show the breakdown for the following metrics:
By default, three charts are generated for each license. |
| API Usage by App |
Bar charts that break down the total traffic to the API by app. This shows metrics for the app's usage of the API, including:
By default, three charts are generated for each app. |
| API Quota Usage | Only valid if a quota policy is attached to a license the API is using. This chart shows app consumption of the API as a bar chart, with each time slot being a bar, and additionally displays the quota threshold as a line across the chart. If the app exceeds the consumption defined by the quota, the bar is shown in red; if the app consumption is within quota, the bar is blue. |
Analytics by License: Graph Controls
When you choose Analytics > Licenses, you can adjust the chart settings so that you see the exact information you need. Settings and their values are shown below.
| Setting | Values/Description |
|---|---|
| Implementation | Sandbox or Live |
| Report period |
A drop-down menu that allows you to select the time period to be shown in the chart. When you select a new duration, the Performance Chart data is automatically refreshed. Choices:
|
| Apps | Defaults to All Apps, but you can choose a specific app. |
| Licenses | Defaults to All Licenses, but you can choose a specific license. |
| Graphs |
Options:
|
To monitor API performance for a specific license
- Go to APIs > My APIs > choose API > Analytics > Licenses.
- Choose values as needed. For details on the options available, refer to Analytics by License: Graph Controls above.
Who can see my API's performance metrics?
To see an API's performance metrics, a user must have one of the following permissions:
- API Admin—Either the user who created the API, or a user who has been invited to join the API Admin team and has accepted the invitation.
- Business Admin
- Monitor—A user who is not an API Admin, but has been assigned Monitor permission, can monitor the API metrics but cannot perform other activities that the API Admin can do, such as modify the API.
How do I monitor my API's performance for a specific app/API contract?
You can view monitoring charts and logs for any specific contract your API has with an app, as long as monitoring is turned on for your API.
Note: If the specified time period includes a point where the contract was revised, or suspended and resumed, or the contract was cancelled and a new one created, the chart or graph shows all transaction info between the app and the API in the selected time period. However, only in the case where the contract was revised, there is uninterrupted service. In other scenarios, service is suspended or stopped and is then resumed or restarted, with a period in between where the contract is not active.
To monitor API performance for a specific contract
- Log in and go to the API Details page for your API.
- On the left menu, click Analytics.
- Choose one of the following options, to view contract information in different ways:
- Overview: Choose the environment. Here, in the Usage by App pie chart, you can see what portion of your API's total traffic is generated by a specific app.
- Charts: Choose the environment and the app, and other values as needed. Here, you can view transaction volume, success/fault, and how the traffic measures against min/max average transaction time, if specified. You can also export the chart information.
- Logs: Choose the environment and the app, and date range if needed. Here, you can view specific transaction logs. You can also export the log information.
- Licenses: Choose the environment and the app, and other values as needed. Choose API Usage by App.
Why is some of my analytics information missing?
The storing of analytic information for app/API usage is controlled by the policies that are attached to the API. For example:
- If you don't attach the AtmosphereApplicationSecurityPolicy policy to the API, calls to the API endpoint are logged, but there are no records of the app/API interactions, such as the APIs > My APIs > choose API > Analytics > Overview > Usage by App chart or, for app developers, the Apps > My Apps > choose app > Analytics > Overview > Usage by API chart.
- If you don't attach the Detailed Auditing policy to the API, calls to the API endpoint show up in the Overview and Charts section but do not appear in the logs.


